Collectd threshold status
Collectd is an easy way of monitoring servers (CPU, memory, network, etc) and using the threshold and the notification plugin we can get notifications via email if some of them hit a threshold.
The only problem is that collectd doesn’t provide a summary of the current status (like, for instance, Jenkins does), that’s why we built our own summary system.
Download from Github
Quick introduction to thresholds and notifications
Collectd provides a plugin called threshold to monitor and dispatch notifications, looking at the values reported by collectd like CPU, memory, etc.
Follow this guide to learn more about thresholds.
The notify_email plugin will send emails to an address of your choice everytime a threshold is reached. More info here.
Read thresholds from the log
If you are using both of the plugins,
the notification will record every threshold in the /var/log/collectd.log file.
[2014-11-20 06:26:44] Notification: severity = FAILURE, host = vpn, plugin = cpu, plugin_instance = 0, type = cpu, type_instance = user, message = Host vpn, plugin cpu (instance 0) type cpu (instance user): Data source "value" is currently 99.432869. That is above the failure threshold of 50.000000.
[2014-11-20 06:28:54] Notification: severity = OKAY, host = vpn, plugin = cpu, plugin_instance = 0, type = cpu, type_instance = user, message = Host vpn, plugin cpu (instance 0) type cpu (instance user): All data sources are within range again.
We are building a bash script that parses that log periodically and generates a json file like this one:
{"servers":[
  {"name":"apps", "status":"OK","message":"Host apps, plugin cpu (instance 0) type cpu (instance user): All data sources are within range again.","timestamp":"2014-12-16 06:26:40","type":"cpu"}
  ,{"name":"ci", "status":"OK","message":"","timestamp":"","type":""}
  ,{"name":"collectd", "status":"OK","message":"","timestamp":"","type":""}
  ]}
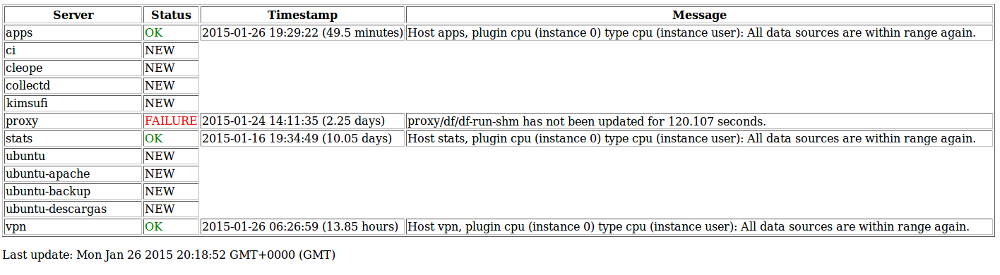
Showing the information in the web
A html file with some [javascript]((https://github.com/coconauts/collectd-threshold-status/blob/master/status.js) is looking at the json file previously generated to build a table with the current status of all thresholds.